KS2 SATs Results Explained: What Scaled Scores Really Tell You About a Primary School
Primary league tables are built on KS2 SATs. Here is what a scaled score of 100 means, what 'the expected standard' is, and how to read a primary school's results without over-reading them.
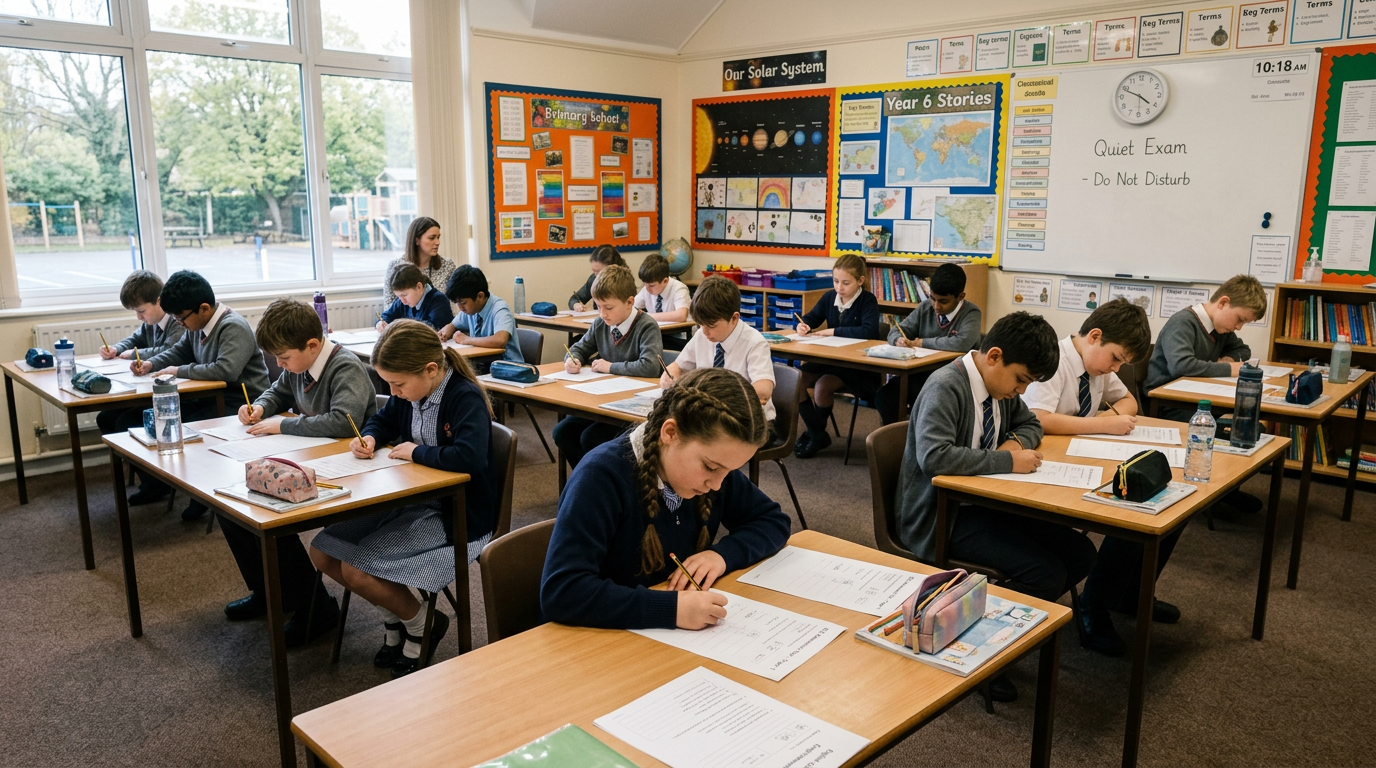
At the end of Year 6, pupils in England sit national curriculum tests known as SATs. Their results feed the primary school performance tables and are often the first hard data parents look at. Understanding how they are scored stops you drawing the wrong conclusions.
What subjects are tested
KS2 SATs cover reading, mathematics, and grammar, punctuation and spelling (GPS). Writing is also assessed, but through teacher assessment rather than a formal test. Science is assessed by teachers in a sample of schools.
Scaled scores: why 100 is the number that matters
Raw test marks are converted into a scaled score ranging from 80 to 120. The pivotal figure is 100: a scaled score of 100 or above means a pupil has met 'the expected standard' for their age. Below 100 means they have not yet met it. Because the conversion is set each year, a scaled score of 100 represents the same standard from one year to the next even if the raw marks needed shift slightly.
What is 'greater depth' or 'higher standard'?
Pupils scoring 110 or above in the reading and maths tests are recorded as working at 'the higher standard'. In teacher-assessed writing, the equivalent is 'greater depth'. A school with a high proportion of pupils at the higher standard is stretching its most able pupils, not just getting them over the line.
The key school-level measures
- Percentage reaching the expected standard in reading, writing and maths combined — the headline figure. The national average typically sits around the low-to-mid 60s per cent.
- Average scaled score in reading and in maths — useful for comparing cohorts.
- Progress scores in reading, writing and maths — measured from pupils' Key Stage 1 results, and, as with Progress 8 at secondary, a fairer indicator of how well the school teaches.
How to read the numbers sensibly
- Cohorts are small. A single Year 6 class might be 30 children, so one pupil is worth three percentage points. Year-to-year swings are normal — look at a three-year picture.
- Prioritise progress over raw attainment. A school in a challenging area with strong progress scores may be doing more for its pupils than a school with high attainment and flat progress.
- Results are one lens. They say nothing about pastoral care, the arts, sport, or whether your child will be happy. Pair the data with a visit.
Where to find them
Each SchoolFinder primary listing shows the school's latest KS2 measures alongside its Ofsted judgement, so you can see attainment and progress in one place and compare nearby schools side by side.
Frequently asked questions
What does a scaled score of 100 mean in KS2 SATs?
A scaled score of 100 means a pupil has met the expected standard for their age. Scaled scores range from 80 to 120, and anything at or above 100 is a pass at the expected standard. A score of 110 or above is recorded as the higher standard.
What is the expected standard in SATs?
The expected standard is the level of attainment the Department for Education considers appropriate for a child at the end of Key Stage 2. A pupil reaches it by achieving a scaled score of 100 or more in the reading and maths tests, and by teacher assessment in writing.
Are SATs progress scores more important than attainment?
For judging how well a school teaches, progress scores are usually the fairer measure because they show how far pupils moved from their Key Stage 1 starting point, rather than simply reflecting the intake the school receives.
Ready to find the right school?
Search and compare primary and secondary schools across England on official DfE and Ofsted data.